
Overview
Get a clear snapshot of your site’s performance and user experience
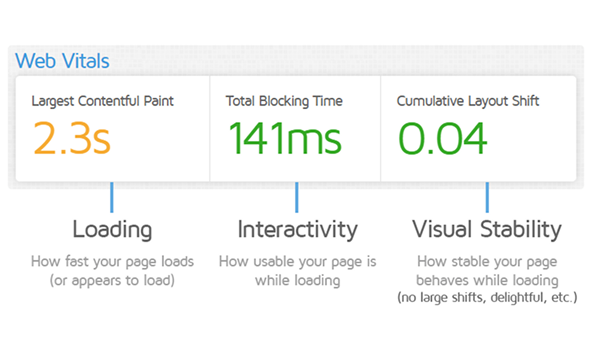
Web Vitals
Learn how and why your website is slow
GTmetrix helps you measure user-centric performance metrics that impact SEO and user experience.
- instantly assess your site’s Largest Contentful Paint (LCP)
- Cumulative Layout Shift (CLS)
- Interaction to Next Paint (INP)
Poor Web Vitals often lead to higher bounce rates and lower conversion.
Lighthouse Performance Score
Understand Your Overall Performance Grade
Learn How and Why Your Website Is Slow
GTmetrix assigns your site a performance score powered by Google Lighthouse.
GTmetrix helps you measure user-centric performance metrics that impact SEO and user experience.
This score aggregates various load metrics and provides a quick way to evaluate how well your site performs. It’s a great starting point to benchmark and monitor changes over time.
- Instantly assess your site’s Largest Contentful Paint (LCP)
- Cumulative Layout Shift (CLS)
- Interaction to Next Paint (INP).
Core Web Vitals show how fast your content appears, how visually stable the page is, and how quickly users can interact.
Poor Web Vitals often lead to higher bounce rates and lower conversion.
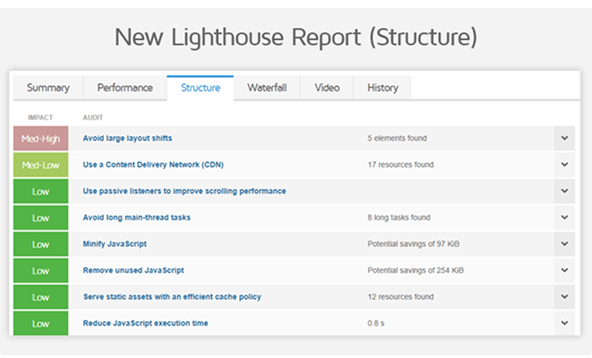
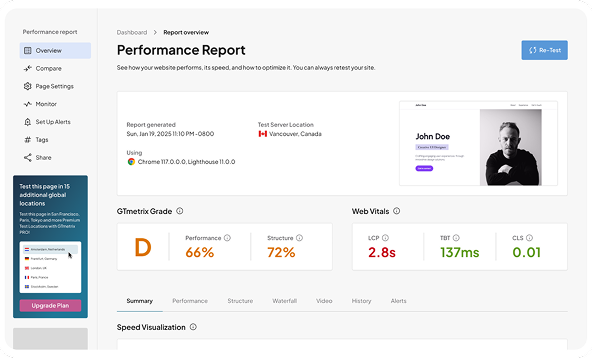
GTmetrix Summary Panel
Get an instant overview
All key performance indicators in one snapshot.
- Speed Index
- TTI
- TBT
- Fully Loaded Time
Each of these tells part of the story. The GTmetrix
Summary Panel gives you everything you need to
understand site speed at a glance.
Real User Experience (CrUX)
See what real users experience
Go beyond lab data with the Chrome UX Report.
GTmetrix integrates CrUX field data to help you see how your website performs in the real world, across different devices and geographies.
This helps you validate lab results with user based insights.