
Understand and Optimize Your Website’s Performance
GTmetrix analyzes how your page loads, uncovers what’s slowing it down, and helps you improve user experience through actionable insights.
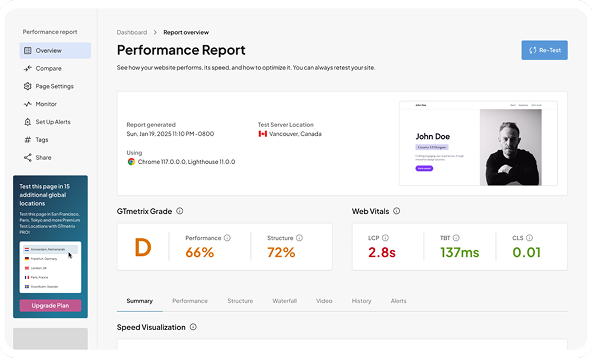
Deep Insights to Understand and Optimize Performance
GTmetrix Reports can tell you exactly how fast your page loads, why its slow, and how to fix it.

Bounce Rate
The slower the site, the faster users leave without interacting.

Traffic
Poor load times drive visitors away before the page even appears.

Revenue
Every second of delay can mean lost sales and fewer conversions.

Conversions
A frustrating experience reduces sign-ups, purchases, and engagement.

Page View Duration
If your site is slow, users won’t stick around to explore.

…and more
SEO, customer satisfaction, brand perception all are affected.
How are your Website’s Web Vitals?
See how your website performs, why it’s slow, and how to optimize it
Analysis Options:
Seattle, WA, USA
Chrome
Unthrottled Connection
-
Overview
-
Analysis
-
Testing Options
-
Monitoring & Alerts
-
Collaborate
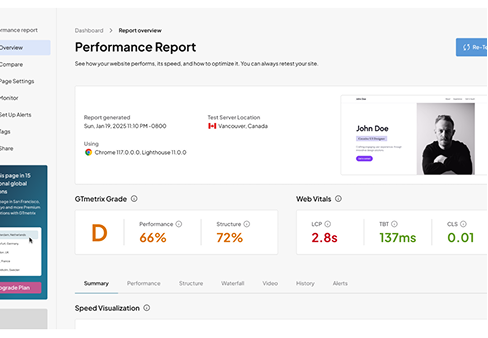
Overview
Get a clear snapshot of your site’s performance and user experience
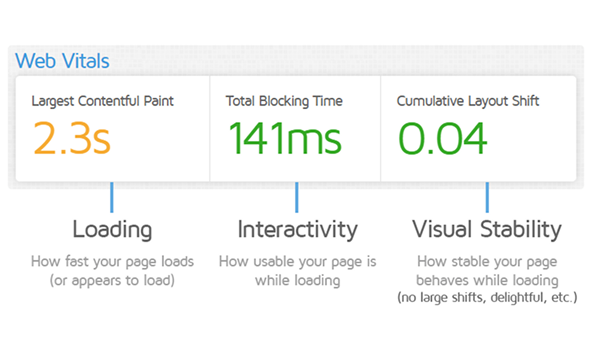
Web Vitals
Learn how and why your website is slow
GTmetrix helps you measure user-centric performance metrics that impact SEO and user experience.
- instantly assess your site’s Largest Contentful Paint (LCP)
- Cumulative Layout Shift (CLS)
- Interaction to Next Paint (INP)
Poor Web Vitals often lead to higher bounce rates and lower conversion.
Lighthouse Performance Score
Understand Your Overall Performance Grade
Learn How and Why Your Website Is Slow
GTmetrix assigns your site a performance score powered by Google Lighthouse.
GTmetrix helps you measure user-centric performance metrics that impact SEO and user experience.
This score aggregates various load metrics and provides a quick way to evaluate how well your site performs. It’s a great starting point to benchmark and monitor changes over time.
- Instantly assess your site’s Largest Contentful Paint (LCP)
- Cumulative Layout Shift (CLS)
- Interaction to Next Paint (INP).
Core Web Vitals show how fast your content appears, how visually stable the page is, and how quickly users can interact.
Poor Web Vitals often lead to higher bounce rates and lower conversion.
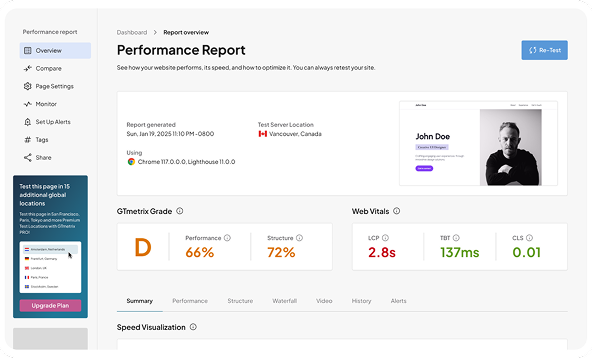
GTmetrix Summary Panel
Get an instant overview
All key performance indicators in one snapshot.
- Speed Index
- TTI
- TBT
- Fully Loaded Time
Each of these tells part of the story. The GTmetrix
Summary Panel gives you everything you need to
understand site speed at a glance.
Real User Experience (CrUX)
See what real users experience
Go beyond lab data with the Chrome UX Report.
GTmetrix integrates CrUX field data to help you see how your website performs in the real world, across different devices and geographies.
This helps you validate lab results with user based insights.
Analysis tools
Get a clear snapshot of your site’s performance and user experience.
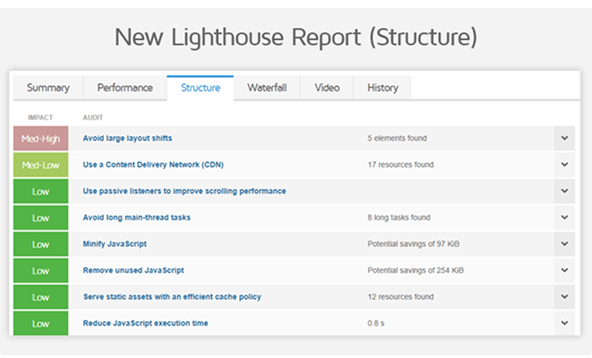
Structure & Audit Reports
Diagnose with confidence
GTmetrix helps you measure user-centric performance
metrics that impact SEO and user experience.
- Instantly assess your site’s Largest Contentful Paint
- (LCP)
- Cumulative Layout Shift (CLS)
- Interaction to Next Paint (INP).
These Core Web Vitals show how fast your content
appears, how visually stable the page is, and how quickly
users can interact. Poor Web Vitals often lead to higher
bounce rates and lower conversion.
Impact-based recommendations
Prioritize What Matters Most
GTmetrix assigns your site a performance score powered
by Google Lighthouse.
This score aggregates various load metrics and provides a
quick way to evaluate how well your site performs. It’s a
great starting point to benchmark and monitor changes
over time.
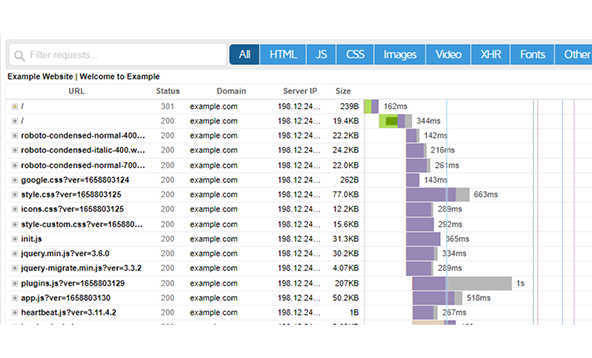
Waterfall Resource Breakdown
Visualize Loading Behavior in Detail
All key performance indicators in one snapshot.
- Speed Index
- TTI
- TBT
- Fully Loaded Time
Each of these tells part of the story. The GTmetrix
Summary Panel gives you everything you need to
understand site speed at a glance.
Filmstrip & Load Video Replay
Watch Your Site Render, Frame by Frame
Go beyond lab data with the Chrome UX Report.
GTmetrix integrates CrUX field data to help you see how
your website performs in the real world, across different
devices and geographies.
This helps you validate lab results with user based insights.
Layout Shift Highlights
Spot and Fix Visual Instability
All key performance indicators in one snapshot.
- Speed Index
- TTI
- TBT
- Fully Loaded Time
Each of these tells part of the story. The GTmetrix
Summary Panel gives you everything you need to
understand site speed at a glance.
CrUX Real-World Data
Understand What Users Actually Experience
Go beyond lab data with the Chrome UX Report.
GTmetrix integrates CrUX field data to help you see how
your website performs in the real world, across different
devices and geographies.
This helps you validate lab results with user based insights.
Testing Options
Run powerful tests to analyze and optimize your site’s speed and performance.
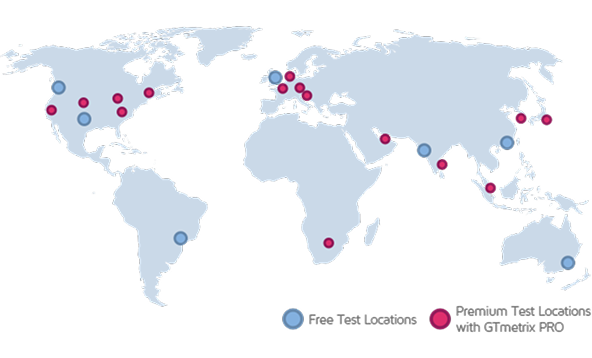
Global Test Locations
Test from anywhere in the world
Simulate visitors from dozens of global locations
See how your website loads for real users across different regions and optimize for worldwide performance.
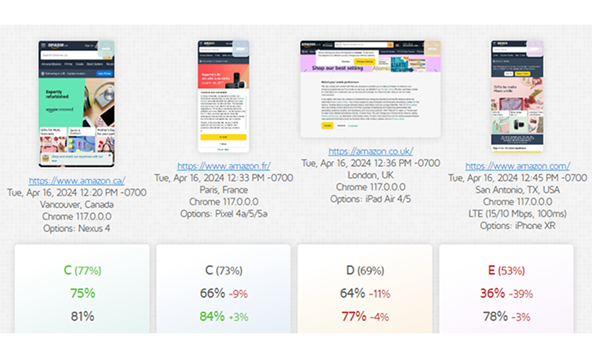
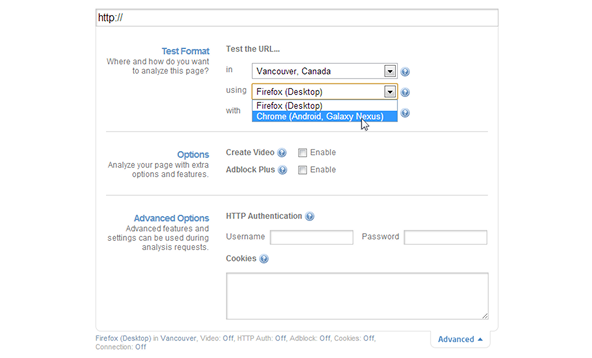
Device & Browser Simulation
See what users experience on every device
Emulate desktop and mobile browsers easily
Test your site as if you were visiting on mobile, tablet, or desktop, and identify performance differences between browsers.
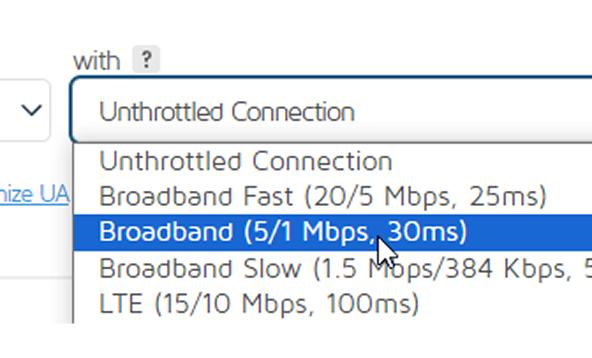
Connection Throttling
Measure speed in real world conditions
Apply network limits like 3G, 4G, or broadband
Check how your site behaves under slower or unstable connections to understand speed and loading issues.
Ad Blocking & JS Controls
Understand the impact of ads and scripts
Disable ads or specific JavaScript functions
Reveal how third party content affects your page load and validate performance in a controlled environment.

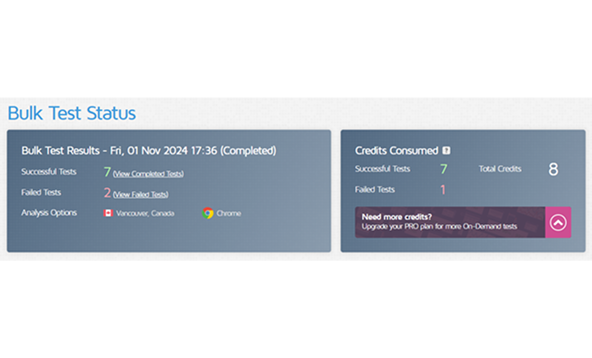
Authenticated Testing
Test pages behind logins
Use credentials to access secure areas
Analyze performance for members only sections or
protected dashboards that regular crawlers cannot access.
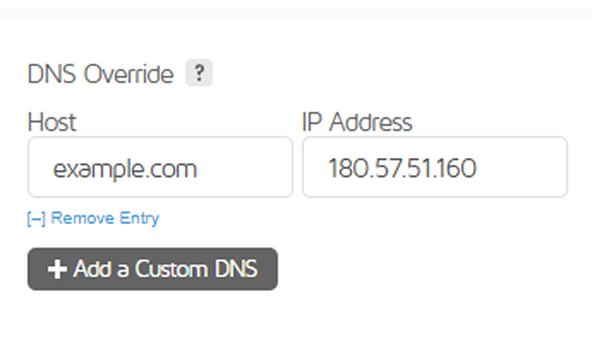
Custom Headers & DNS
Adapt tests to advanced scenarios
Add headers or DNS rules to replicate custom setups
Validate how your site behaves under special
configurations, APIs, or routing rules.
Monitoring & Alerts
Run powerful tests to analyze and optimize your site’s speed and performance.
Scheduled Testing
Automate your performance checks
Run tests daily, weekly, or hourly
Ensure your site stays fast over time without manual effort, and catch regressions early.
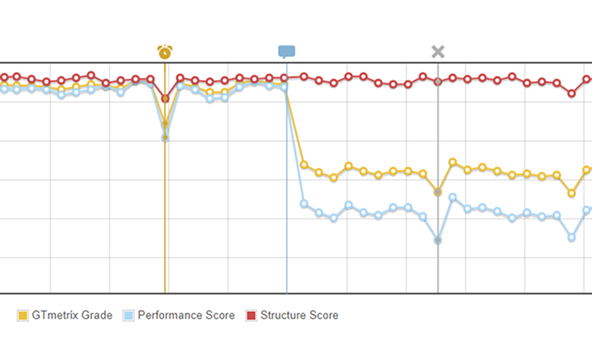
Performance Trends
Visualize progress over time
Track performance metrics across days, weeks, or months
See how changes to your site affect speed and stability, and benchmark your improvements with clear graphs.
Custom Alerts
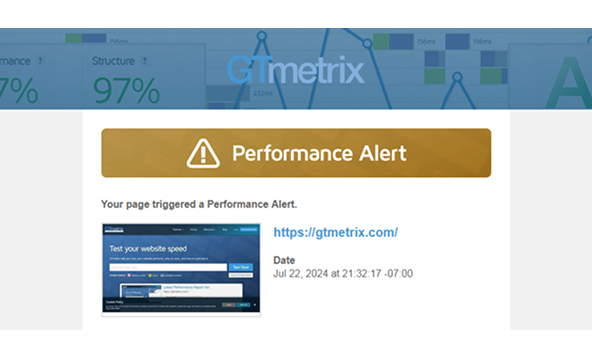
Stay informed when performance drops
Set thresholds and receive instant notifications
Get alerts by email or webhook whenever your site falls below your standards, so you can act quickly.
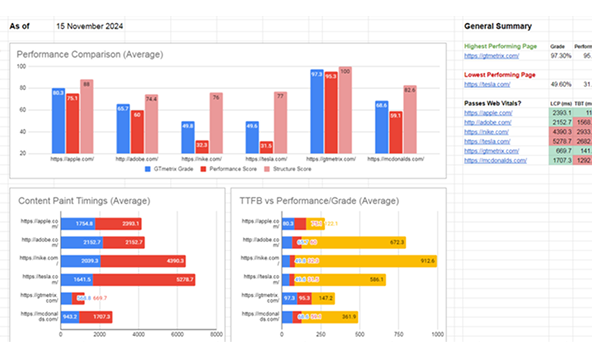
Export & Share Reports
Collaborate with your team easily
Download or share reports in multiple formats
Export results as PDF or CSV, or share live report links for smooth communication and documentation.
Collaboration & Workflow
Simplify teamwork and performance reporting across your organization.
Multi‐User Accounts & Team Roles
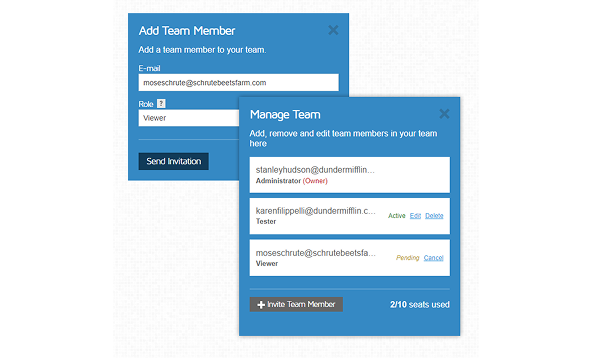
Empower your whole organization
Invite multiple users and assign roles to manage access and responsibilities.
Give developers, marketers, or clients exactly what they need—nothing more, nothing less. Organize your team by project or domain and control access through Viewer, Tester, Admin, or Owner roles.
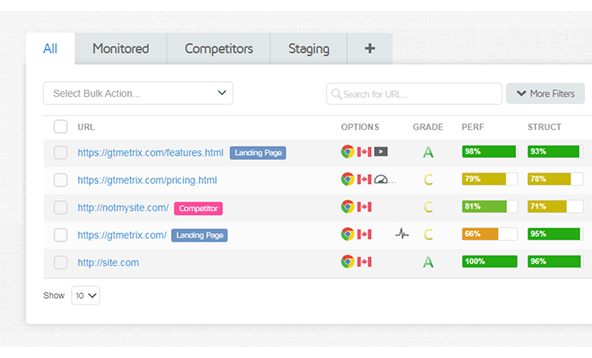
Tags, Filters & Organized Projects
Keep your dashboard clean and scalable
Use tags, folders, and Projects to keep everything where it belongs.
Whether managing 5 or 500 pages, structured organization lets you focus your analysis, prioritize issues, and collaborate efficiently across clients or departments.
Shareable Reports & Collaboration
Keep everyone aligned with accessible results
Share test results via public or private URLs, PDFs, or exports—no login required.
Make it easy to communicate insights to stakeholders, clients, or teammates, even outside your GTmetrix account.
Audit Scheduling & Alert Management
Stay in sync with automated workflows
Set shared alerts and scheduled testing so nothing slips through the cracks.
With real time alerts and team wide visibility, performance regressions are caught early, and action can be taken instantly.